 DASHMODE
← All research · RWA measurement
RWA · Tokenized stocks · Measurement
RWA crypto review: issued value and actual use are different stories
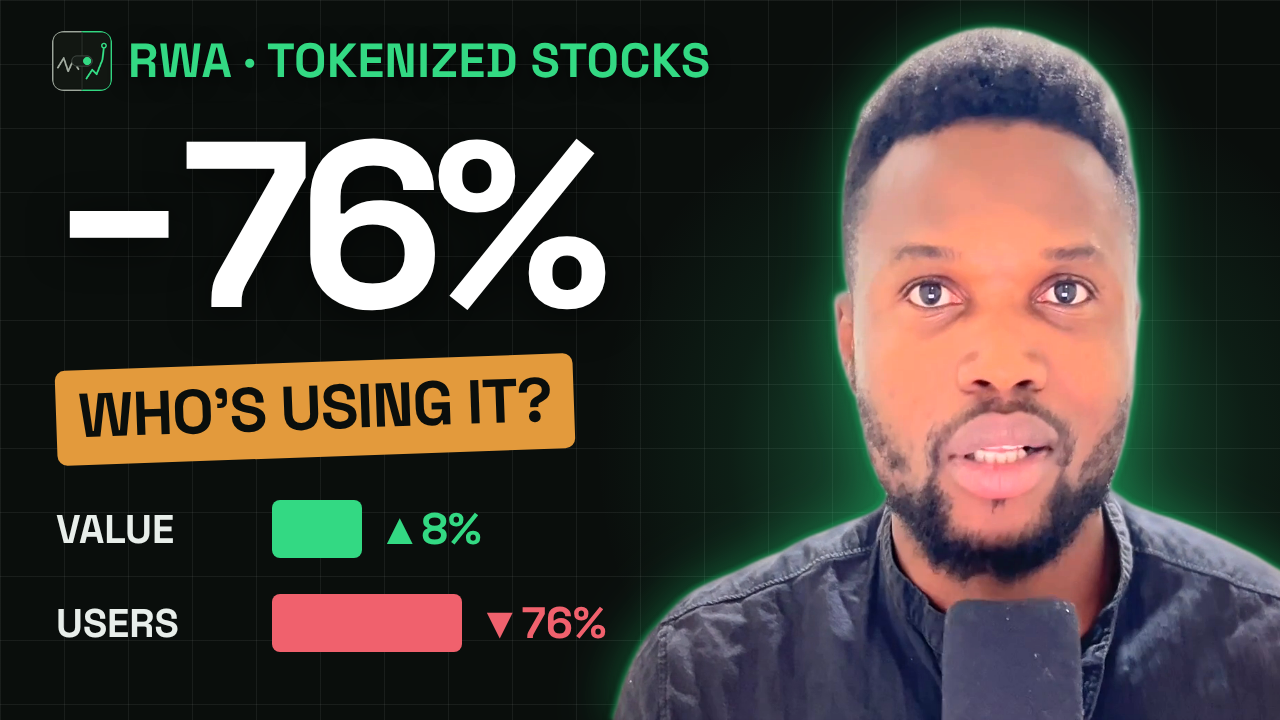
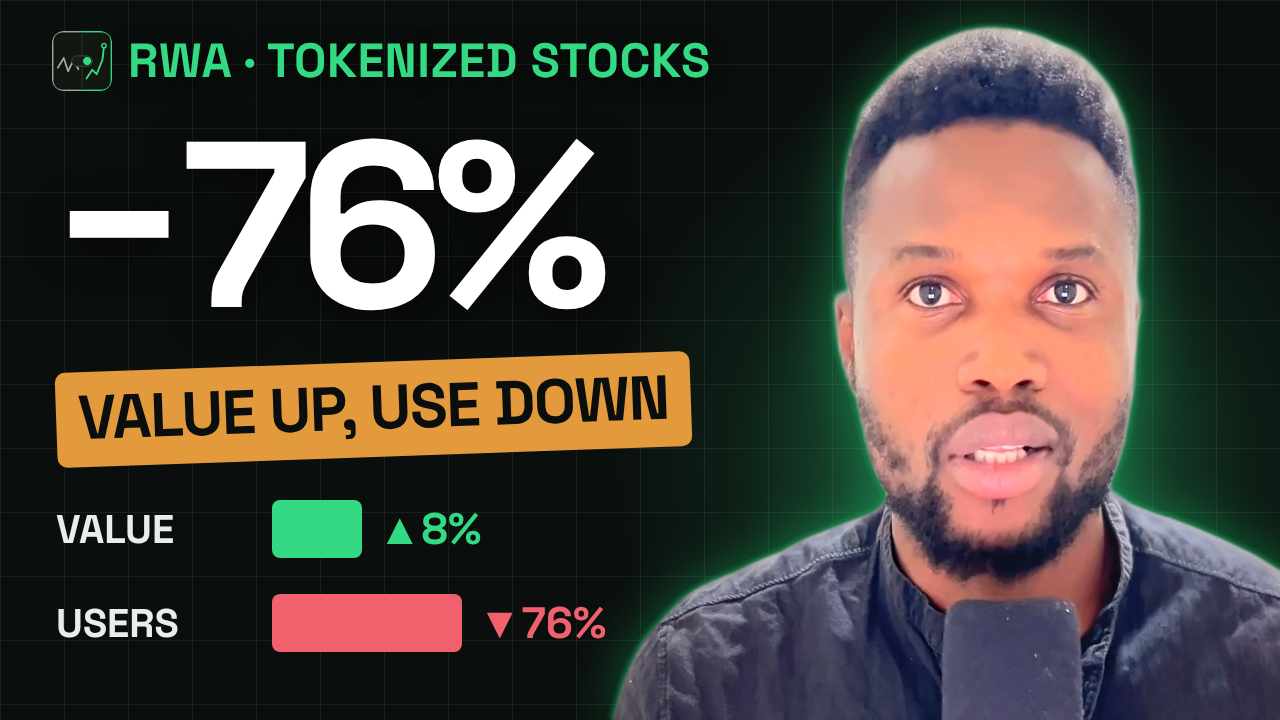
Tokenized stocks grew 8% in value last month. Over the same month, transfer volume fell 65% and active addresses fell 76%. Scale and use moved in opposite directions. Explaining why needs more data; what the split shows already is that "how much exists" and "how much is used" are separate questions.
RWA.xyz · tokenized stocks · vs 30 days earlier
Diverging
Distributed value$3.18B
▲ 8.02%
▲ 8.02%
Transfer volume, 30d$11.24B
▼ 64.75%
▼ 64.75%
Active addresses, 30d834,624
▼ 75.89%
▼ 75.89%
TL;DR
- Tokenized-stock value rose 8.02% to $3.18B, while monthly transfer volume fell 64.75% and active addresses fell 75.89%.
- Working back from those changes, the prior month had about $31.9B of transfers and 3.46M active addresses, a level worth checking before calling this a decline.
- A transfer isn't a trade, and a quiet balance isn't failure. The right metric depends on what the asset is for.
- DeFi utilization needs one consistent denominator and controls for double counting, or re-deposited receipt tokens inflate it.
Dashboard 01
Scale vs activity at a glance
RWA.xyz tokenized stocks · prior-month values derived from displayed % change
Distributed value
$3.18B▲ 8.02%
≈ $2.94B a month earlierTransfer volume, 30d
$11.24B▼ 64.75%
≈ $31.9B a month earlierActive addresses, 30d
834,624▼ 75.89%
≈ 3.46M a month earlierTransfers per $ of value
3.5×
≈ 10.8× a month earlierTransfers per active address
$13.5k▲ 46%
≈ $9.2k a month earlierValue per active address
$3.8k
≈ $0.85k a month earlierCause of the divergence
n/aUnexplained
Needs price, issuance, coverage checksVerified secondary trades
n/aNot measured
Transfers ≠ trades01 / The divergence
The stock snapshot shows scale and use pulling apart
RWA.xyz's tokenized-stock dashboard showed distributed value of $3.18B, up 8.02% on 30 days earlier. Monthly transfer volume was $11.24B, down 64.75%. Monthly active addresses were 834,624, down 75.89%.
Explaining that needs checks on prices, new issuance, unusual transfers in the earlier period and changes in what the dashboard covers. Working back from the percentage changes, the prior month carried roughly $31.9B of transfers across 3.46M addresses. That points at the earlier month as a possible outlier, but it's a lead, not an explanation. The unanswered question is part of the finding.
Dashboard 02
One month, opposite directions
RWA.xyz · change vs 30 days earlier
Transfer volume, $B
Active addresses, M
"Month earlier" values are derived as current ÷ (1 + change); they are calculations, not separately retrieved observations.
Dashboard 03
How intensively the value moves
Ratios derived from the snapshot
Monthly transfers ÷ distributed value
Each dollar of tokenized stock moved about 3.5 times in the latest month, down from about 10.8.
Transfer volume per active address
Fewer addresses, each moving more. Consistent with a smaller set of larger movers, but not proof of it.
Dashboard 04
What could explain the divergence
Checks needed before any explanation · none completed here
◐ To checkPrice changes
Distributed value rises when the underlying stocks rise, with no new tokens or users.
◐ To checkNew issuance
Minting adds value without any secondary activity.
◐ To checkUnusual prior-month transfers
The implied $31.9B and 3.46M addresses a month earlier may have been a one-off spike.
◐ To checkCoverage changes
Assets, chains or platforms added or dropped from the dashboard universe.
02 / Transfers
A transfer is not a trade
Tokens move for custody, collateral, bridge routing and administrative reasons. A transfer count can't show that the recipient paid a market price. The reverse also holds: trades inside a custodial venue may not create a separate on-chain transfer for each customer, so a chain-only measure can capture routing while missing real trading.
To measure secondary-market demand you need verified trade events with consistent inclusion rules. To measure financial integration you need collateral deposits and borrowing. The metric has to match the claim.
Dashboard 05
Why a token moves, and whether it's a trade
Reasons behind on-chain transfers
| Reason | Is it a market purchase? | Shows on-chain? | Counts in transfer volume? |
|---|---|---|---|
| Secondary trade on a DEX | ● Yes | ● Yes | ● Yes |
| Trade inside a custodial venue | ● Yes | ✕ Often not per trade | ✕ Often missed |
| Custody move | ✕ No | ● Yes | ● Yes |
| Collateral deposit | ✕ No | ● Yes | ● Yes |
| Bridge routing | ✕ No | ● Yes | ◐ Can count twice |
| Administrative / issuer | ✕ No | ● Yes | ● Yes |
Transfer volume over-counts movement that isn't trading and can under-count trading that stays off-chain.
03 / Purpose
DeFi use is one outcome, not a requirement
"How much is used?" has to allow for what the asset is for. A yield-bearing investment token held to maturity can be doing its job without frequent transfers or anyone borrowing against it. Low turnover alone isn't evidence of failure.
For a token sold as a building block for lending and settlement, collateral use and repeated financial activity matter much more. Judge the promised function, rather than expecting every asset to trade like a volatile cryptocurrency. That avoids two opposite mistakes: counting every issued dollar as adoption, and calling every quiet balance unused.
Dashboard 06
Match the metric to the asset's job
Which evidence shows adoption for which purpose
| Asset's intended job | Evidence of adoption | Misleading if used alone |
|---|---|---|
| Capital formation | Net issuance and redemption over time | Transfer volume |
| Investment / yield holding | Holders retained, balances held, redemptions honoured | Low turnover read as failure |
| Market access (e.g. stocks) | Verified secondary trades and executable depth | Distributed value |
| DeFi building block | Unique collateral deposits, borrowing, number of markets | Gross TVL with re-deposits |
04 / Utilization
A utilization ratio needs one consistent denominator
The tempting metric is value deposited in DeFi divided by the token's market value. It only works if both figures cover the same instruments, at the same time, with compatible valuation. Take an illustrative $100M outstanding with $20M deposited as collateral: 20%. If the receipt token from that deposit is deposited somewhere else, counting the second deposit too overstates the real underlying exposure.
DefiLlama's methodology discusses controls for re-deposited receipt and LP tokens; a utilization study needs the same care per instrument. Companion measures help: borrow utilization, how many markets support the asset, and how concentrated deposits are. A 20% ratio spread across many independent apps is a different story from 20% in one market held by a few accounts.
Dashboard 07
The double-counting trap
Illustrative · $100M asset outstanding · not a measured portfolio
Naive vs unique utilization
$20M deposited; its $15M receipt token re-deposited elsewhere. Naive sum 35%; unique exposure still 20%.
Same 20%, different depth
Largest marketOther markets
Broad: spread across 8 markets. Concentrated: 90% in one market.
05 / Structure
Legal structure is part of the adoption story
Tokenization combines an on-chain record with a financial claim. How enforceable that claim is, how redemption works and what the token depends on operationally decide whether it suits a given use. xStocks' documentation, for example, describes a tracker certificate with a collateral-security structure. That matters for its financial use, and being transferable doesn't remove it.
An RWA dashboard should keep structure alongside activity. A treasury instrument, a private-credit exposure and a stock-linked certificate can sit in the same broad category with very different valuation, access and redemption. Adding them together without that context can produce a misleading growth story.
Dashboard 08
One category, very different instruments
Generic characteristics; individual products differ
| Type | What it's priced on | Typical access | Redemption | Natural activity level |
|---|---|---|---|---|
| Treasury-related | Short-term rates; stable NAV | Often whitelisted / qualified | Issuer, usually regular windows | Low turnover; held for yield |
| Private credit | Loan book; periodic valuation | Often restricted | Limited, can be gated | Low; illiquid by design |
| Stock-linked certificate | Underlying share price | Non-US, KYC for primary | Issuer, conditions apply | Trading-driven |
Simplified for comparison. Check each instrument's documents for its actual terms.
Dashboard 09
Evidence scorecard
What the snapshot supports today
Value and activity diverged last month
● Established+8.02% value vs −64.75% transfers and −75.89% addresses.
The prior month looks unusually active
◐ DerivedImplied ≈$31.9B transfers, ≈3.46M addresses; derived.
Tokenized-stock adoption is falling
✕ Not establishedActivity fell, but the cause is unexplained.
Transfer volume measures trading
✕ Not supportedTransfers include custody, collateral and routing.
These trends apply to all RWAs
✕ Not supportedStock universe only; not extrapolated.
DeFi utilization of RWAs
✕ Not measuredNo contract-level utilization or borrow study done.
06 / DashMode's assessment
Measure each asset by what it was built to do
The evidence supports separating scale from activity. In this snapshot, distributed value rose while transfers and active addresses fell, and more data is needed to explain it.
For RWA research generally, follow each asset's purpose: issuance and redemption for capital formation, verified trades for market demand, and unique collateral exposure for DeFi integration. Those views can sit side by side without pretending they measure the same thing.
Dashboard 10
DashMode's RWA review method
Steps for an asset-specific review
Name the jobCapital formation, holding, market access or DeFi collateral.
Read the structureClaim, redemption terms and operational dependencies.
Split the activityVerified trades vs custody, collateral and routing transfers.
Count unique exposureRemove re-deposited receipt and LP tokens.
Explain changesPrice, issuance, coverage and one-off spikes before any story.
Sources
Stock value, transfers and address metrics RWA.xyz
TVL and double-counting methodology DefiLlama
Product legal structure xStocks
Methodology and limits. The quantitative figures use RWA.xyz's tokenized-stock universe and its displayed rolling comparisons, retrieved on 12 Sep 2026; the exact upstream cutoff and historical constituent list were not available. Prior-month values and ratios are derived from the displayed figures and percentage changes. No independent contract-level utilization or borrow study was completed. Stock metrics are not extrapolated to the wider RWA market, and transfer volume is not labelled as trading volume. Dashboards 07 and 08 are illustrative. Not investment advice.