 DASHMODE
← All research · Stablecoin supply
Video breakdown
Phil walks through the stablecoin supply review.

Stablecoins · USDT · USDC · USDS · USDe
Stablecoin supply review: modest market growth hides diverging issuer trends
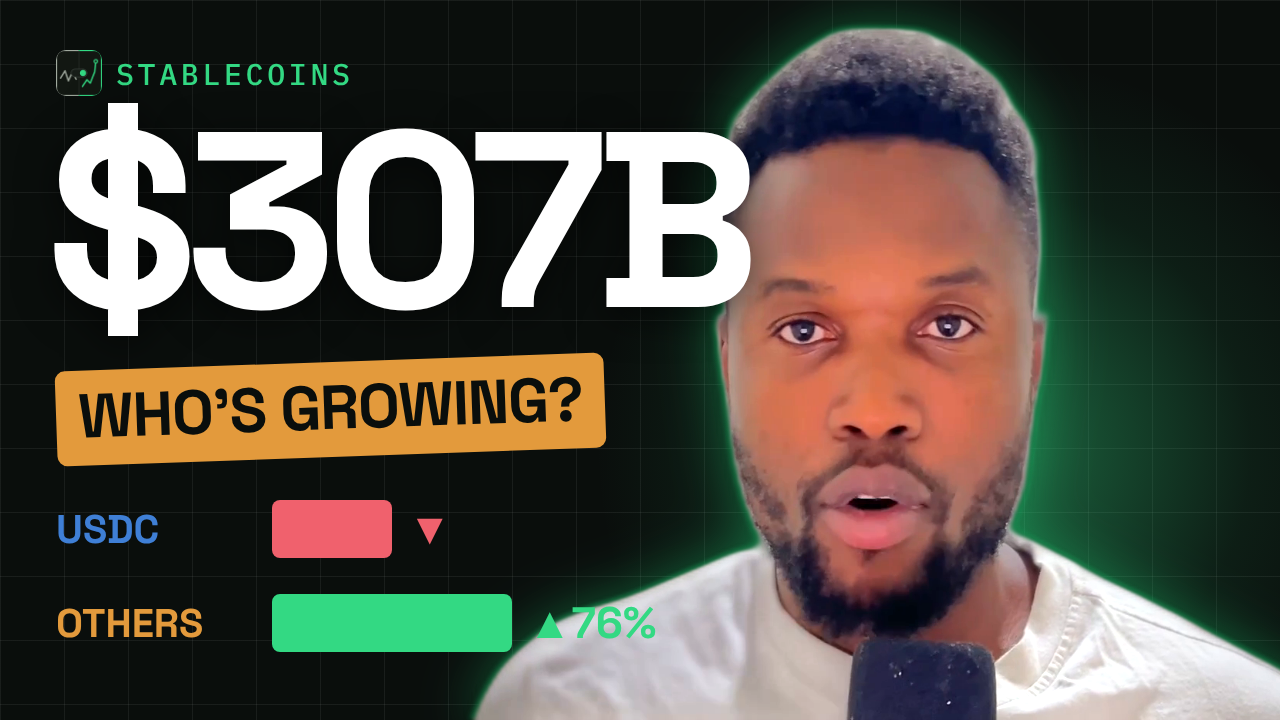
Total stablecoin supply rose $1.38B this week, under half a percent. Underneath, USDC shrank, USDS sped up, and USDe's monthly surge had almost stopped. Most of the week's growth didn't even come from the four biggest names. A rising total is not universal expansion.
DefiLlama stablecoins
▲ $1.378B · 7d
$307.13B TOTAL MARKET CAP
| Asset | Market cap | 7d | 1 month |
|---|---|---|---|
| USDT | $184.21B | +0.23% | +0.46% |
| USDC | $73.82B | −0.42% | −0.95% |
| USDS | $6.89B | +3.01% | +3.75% |
| USDe | $4.88B | +0.32% | +11.26% |
TL;DR
- Stablecoin supply rose $1.378B in a week to $307.13B. USDT and USDC hold 84% of it, and they moved in opposite directions.
- The four named coins explain only about $0.33B of the weekly rise. Roughly $1.05B (76%) came from the other stablecoins, 12% of supply.
- USDS's weekly growth is 13× USDT's in percentage terms, yet USDT still added about twice the dollars.
- USDe grew 11.26% over the month but only 0.32% this week: about 97% of its monthly gain came before the last seven days. The cause isn't in the data.
Dashboard 01
Supply at a glance
DefiLlama · snapshot 26 Sep 2026 · dollar changes derived from displayed %
Total supply
$307.13B▲ $1.38B 7d
≈ +0.45% in a weekUSDT + USDC share
84.0%
Moving in opposite directionsUSDT, 7d
+$0.42B▲ 0.23%
Largest dollar gain of the fourUSDC, 7d
−$0.31B▼ 0.42%
Only one of the four shrinkingUSDS, 7d
+$0.20B▲ 3.01%
13× USDT's growth rateUSDe, 7d
+$0.02B▲ 0.32%
vs +11.26% over the monthAll other stablecoins, 7d
≈ +$1.05B76% of growth
Derived residual · ≈ +2.9%Where it's held or used
n/aNot measured
Market cap can't show this01 / Concentration
Two issuers, 84% of the market
DefiLlama showed $307.134B of stablecoins, up $1.378B over seven days. USDT ($184.2B) and USDC ($73.8B) make up about 84% of it. A market this concentrated can grow while exposure to two issuers' operations and redemption processes stays just as concentrated.
The labels also hide different designs. USDT and USDC are fiat-backed. USDS is Sky's stablecoin, backed by a mix of crypto and real-world assets. USDe is Ethena's synthetic dollar, backed by hedged crypto positions. Calling them all "stablecoins" doesn't make their reserves equivalent.
Dashboard 02
Who holds the $307B
Share of total market cap · DefiLlama
USDTUSDCUSDSUSDeAll others
| Asset | Issuer | Design | Share |
|---|---|---|---|
| USDT | Tether | Fiat-backed reserves | 60.0% |
| USDC | Circle | Fiat-backed reserves | 24.0% |
| USDS | Sky | Crypto and real-world-asset collateral | 2.2% |
| USDe | Ethena | Synthetic dollar, hedged crypto positions | 1.6% |
Designs summarised at a general level; reserve adequacy and redeemability need each issuer's own evidence.
02 / Percent vs dollars
Faster growth is not bigger growth
USDS grew 3.01% this week, about 13× USDT's 0.23%. But on a $6.9B base that's roughly +$0.20B, while USDT's small rate on $184B added about +$0.42B. USDC fell about $0.31B. A large percentage on a small balance can contribute fewer dollars than a small percentage on a large one.
Add up the four named coins and they explain only about $0.33B of the week's $1.378B rise. The other ~$1.05B came from everything else, about 12% of supply growing roughly 2.9% in a week. That's a residual from rounded figures, but it's a clear lead: the headline growth this week mostly happened outside the coins people usually quote.
Dashboard 03
Weekly change: percent vs dollars
7-day change · dollar values derived from displayed % and market cap
7-day change, USD B
Dashboard 04
Building the $1.378B weekly increase
USD B · "all others" is the residual and carries rounding error
03 / Pace
The weekly and monthly windows disagree
If a coin grew at a steady pace, the last 7 days would account for about 23% of its 30-day change. USDe's last week accounts for about 3%: it grew 11.26% over the month and just 0.32% this week, so nearly all of the surge happened earlier. USDS runs the other way: about 81% of its monthly gain came in the last week. USDT and USDC both did about half their monthly move in the last seven days.
That shows the pace differs across windows. It doesn't show why. A promotion, a change in demand for collateral, or broader positioning would each need independent evidence.
Dashboard 05
Weekly vs monthly change
DefiLlama displayed changes
7-day changeMonthly change
Dashboard 06
How much of the month happened in the last week
7-day $ change ÷ 30-day $ change · derived · dashed line = steady pace (7 ÷ 30 ≈ 23%)
The month in two parts, indexed
USDTUSDCUSDSUSDe
Reading the pattern
USDe
StalledSurge happened in the first three weeks; last week nearly flat.
USDS
AcceleratingMost of the month's growth landed in the last week.
USDT
Picking upHalf the month's gain in the last week.
USDC
DecliningShrinking in both windows, faster recently.
Two-segment paths only: month ago → week ago → now. What happened within each segment isn't observed.
04 / Interpretation
Three questions, and market cap answers less than two
A useful stablecoin review asks how much dollar liquidity exists, which issuers dominate it, and where it is held or used. Market cap partly answers the first two. It says nothing about whether balances sit on exchanges, in lending pools or in wallets nobody touches.
Market-cap changes can also come from valuation effects, coverage updates and minting or redemption. They don't prove cash entered crypto trading. Reserve adequacy, redeemability and how fast the coins actually circulate all need separate evidence.
Dashboard 07
What this snapshot can answer
The three-question stablecoin review
How much exists?
Total and per-coin market cap, and how it changed.
● AnsweredWho dominates it?
Shares by issuer; design and reserve differences need more than labels.
◐ PartlyWhere is it used?
Exchanges, lending, trading pools or idle wallets.
✕ Not answeredDashboard 08
Evidence scorecard
What the snapshot supports today
Total supply grew modestly over the week
● Established+$1.378B, about +0.45%.
Issuers moved in different directions
● EstablishedUSDC down; USDT, USDS and USDe up.
Most weekly growth came from outside the top four
◐ Derived≈ $1.05B residual; derived from rounded figures.
USDe's growth slowed sharply
◐ Derived≈97% of monthly gain before the last week; derived.
New cash entered crypto trading
✕ Not establishedMarket cap mixes minting, valuation and coverage.
The cause of USDe's slowdown
✕ Not establishedNeeds independent evidence.
05 / DashMode's assessment
A rising total is not universal expansion
The stablecoin market grew slightly this week, but its two biggest issuers moved in opposite directions, the smaller ones moved at very different speeds, and most of the growth came from outside the names people quote. Reading the total alone would miss all of that.
The next step is the part market cap can't show: where these balances sit and what they do. That turns supply into a capital story that can be checked.
Dashboard 09
DashMode's supply-review method
For a recurring stablecoin report
Split by issuerNever report only the total; show each coin's direction.
Percent and dollarsGrowth rate beside dollar contribution.
Several windowsWeek and month together to show changes in pace.
Mint, burn, valueSeparate issuance from valuation and coverage effects.
Follow the balancesExchanges, lending, pools and idle wallets.
Sources
Methodology and limits. Uses displayed dollar market caps from one DefiLlama snapshot retrieved on 26 Sep 2026, not a reconstructed token-supply ledger. Shares, dollar changes and earlier-period values are derived from rounded displayed figures as value − value ÷ (1 + change); the "all others" change is a residual and carries the combined rounding error. Market-cap changes can include valuation effects, coverage updates and minting or redemption, and do not prove cash entered crypto trading. Issuer design descriptions are general; reserve adequacy, redeemability and velocity need separate evidence. Exact upstream cutoffs were unavailable. Dated research, not a live feed. Not investment advice.